
Have you ever wondered what course and professor to take? I’m pretty sure we all have. Unfortunately, ratemyprofessor.com has subjective ratings for each professor and Koofers is often out of date and provides minimum insight.
What you may not know, is that you can submit a FOIA request the grade distribution for every course, professor, GPA, for the past five to ten years! Even better, it is usually free as long as you file a waiver claiming you wont use the data for commercialization purposes[1]. In other words, as long as you use the data yourself, and share it with friends.
I went ahead and did this for the University of Illinois Urbana-Champaign grade distributions, even though it was my last semester at the university. I thought it would be interesting to try and teach others about FOIA requests, I wrote previously about that in my article titled Announcing Easy A. It’s interesting to note how strongly universities seem to oppose this, but I digress…
Rather than diving into my vision for Easy A, let’s dive into the UIUC data, and why it’s so awesome!
University of Illinois Urbana-Champaign Grade Distributions
Before I dive to into the data, lets see a brief overview!
First, I calculated the average GPA for each subject at the University of Illinois Urbana-Champaign[2]:
- University of Illinois average GPA: 3.421
- The worst GPA by subject: Russian (RUSS) – 2.83 average
- The best GPA by subject: Education (EDUC) – 3.922 average
As you can imagine there are quite a few subjects (150), so I’ll more just pick and choose…
- Accounting (ACCY): 3.402
- Aerospace Engineering (AE): 3.334
- Anthropology (ANTH): 3.315
- BioEngineering (BIOE): 3.530
- Chemistry (CHEM): 3.204
- Computer Science (CS): 3.246
- Electrical and Computer Engineering (ECE): 3.111
- English (ENG): 3.680
- History (HIST): 3.182
- Integrative Biology (IB): 3.354
- Mathematics (MATH): 2.974
- Mechanical Science and Engineering (ME): 3.352
- Molecular and Cellular Biology (MCB): 3.187
- Philosophy (PHIL): 3.158
- Statistics (STAT): 3.372
The most interesting aspect of this, is that history majors have a lower on average GPA than CS students. It should be noted, this does not necessarily mean their courses are harder, as history majors may have a lower caliber student on average, or not. We really cannot make stipulations to that degree. It is however, clear that in some majors, the average GPA is much higher.
For example, an integrative biology student likely has an average GPA 0.167 higher over their molecular and cellular biology counterparts. This is pretty significant for medical schools, and may dash the dreams of several would be medical students.
Course Specific Distributions
Although averages of entire subjects are pretty cool, they really don’t help most of us. Most college students wonder,
Should I take this course with this professor?
To which there is usually large number of comments such as the following:
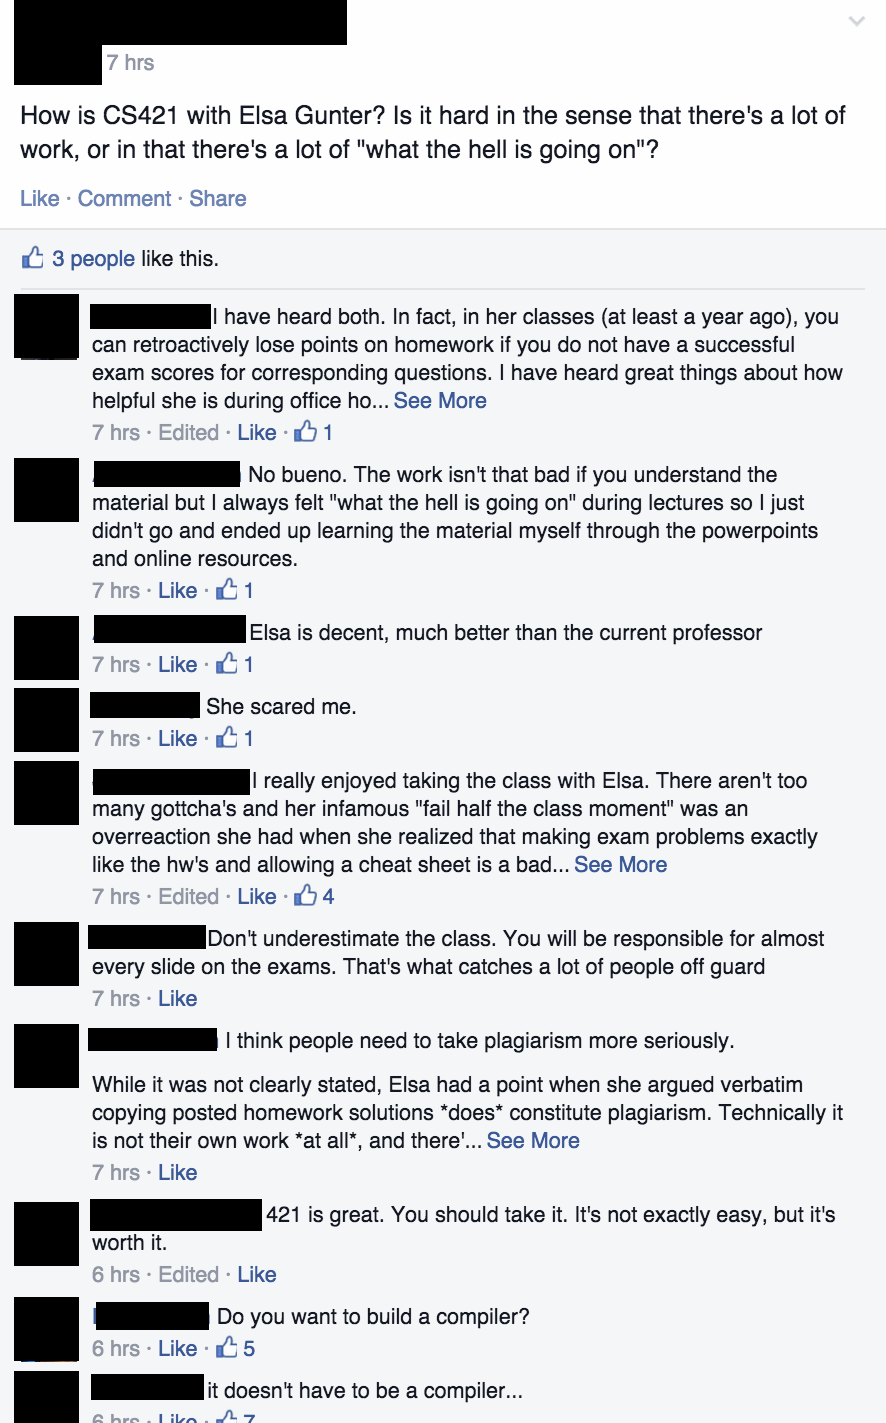
I only posted about a quarter of the comment thread. Now, during the course selection season, as a student at UIUC you’ll be bombarded with about 10 – 20 of these a day for a week. More importantly, there will be discussion all over the campus, and it’s 100% subjective. You’ll hear horror and love stories for the same semester.
The fact is, it has never mattered that much to me personally, I picked what I wanted to learn and learn on my own. However, for most students that isn’t the case, and that’s why ratemyprofessor.com and Koofers can make millions a year. Easy A is my spin on it, basically a way to quickly query specific classes, see and compare each professor (and soon advice from previous semesters, as well as resources).
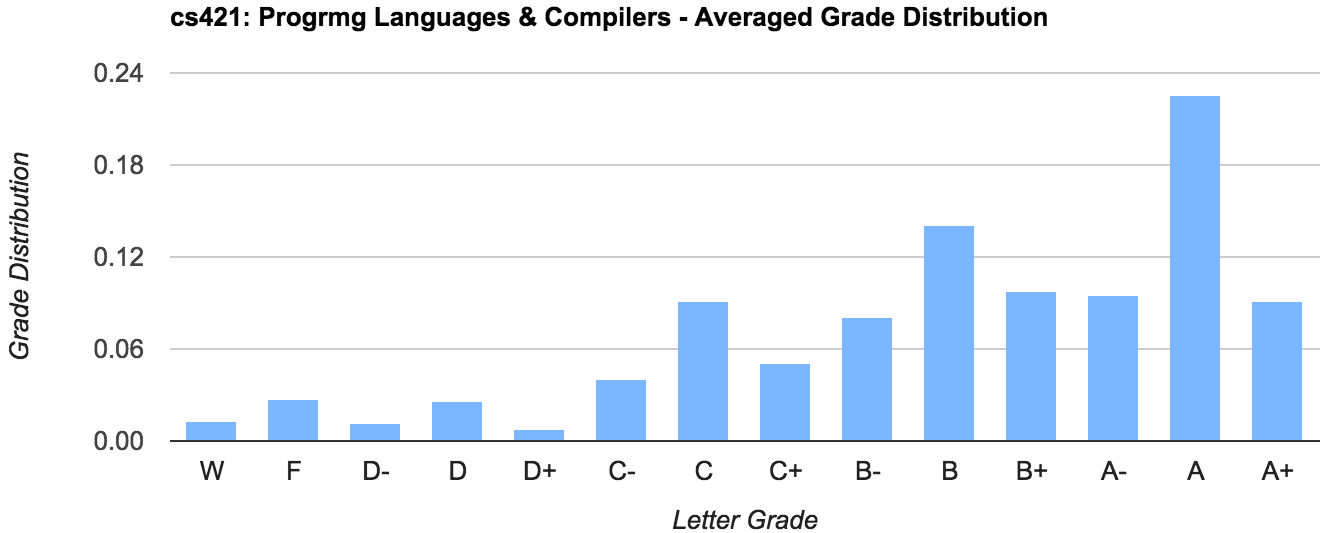
Let’s take the example above, what does the grade distribution of cs421 usually look like?
How about Elsa Gunter:
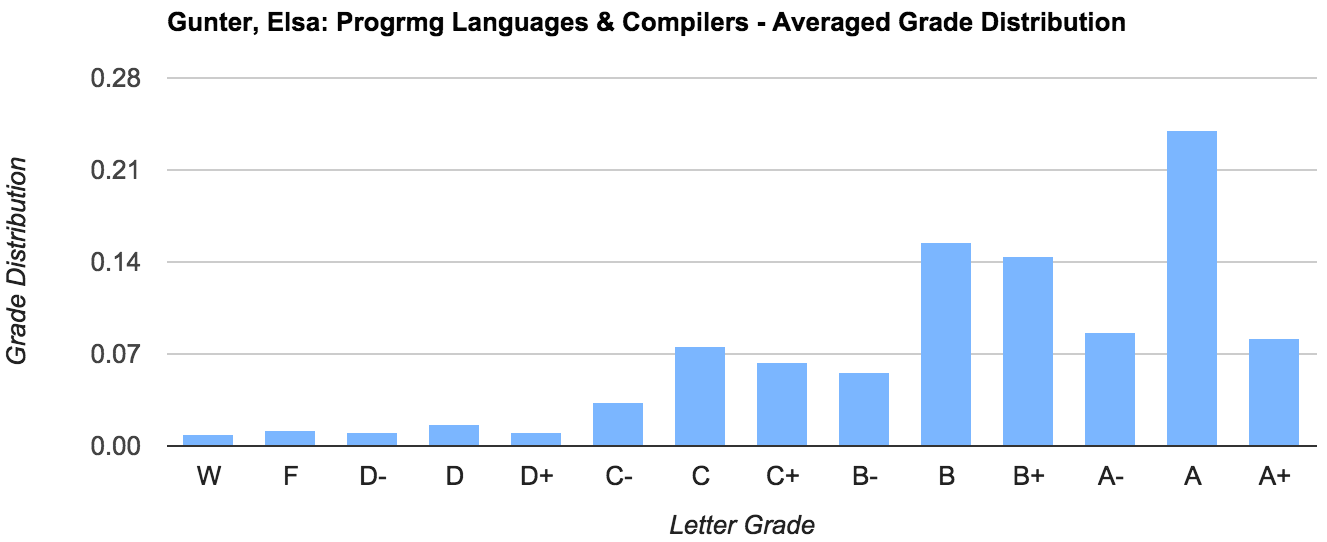
Looks like Professor Gunter’s grade distribution was a bit better, I’d recommend her if you intend to go to graduate school (she also currently the best teacher for cs421, in my opinion). Does this conclusion match the average GPA on average?
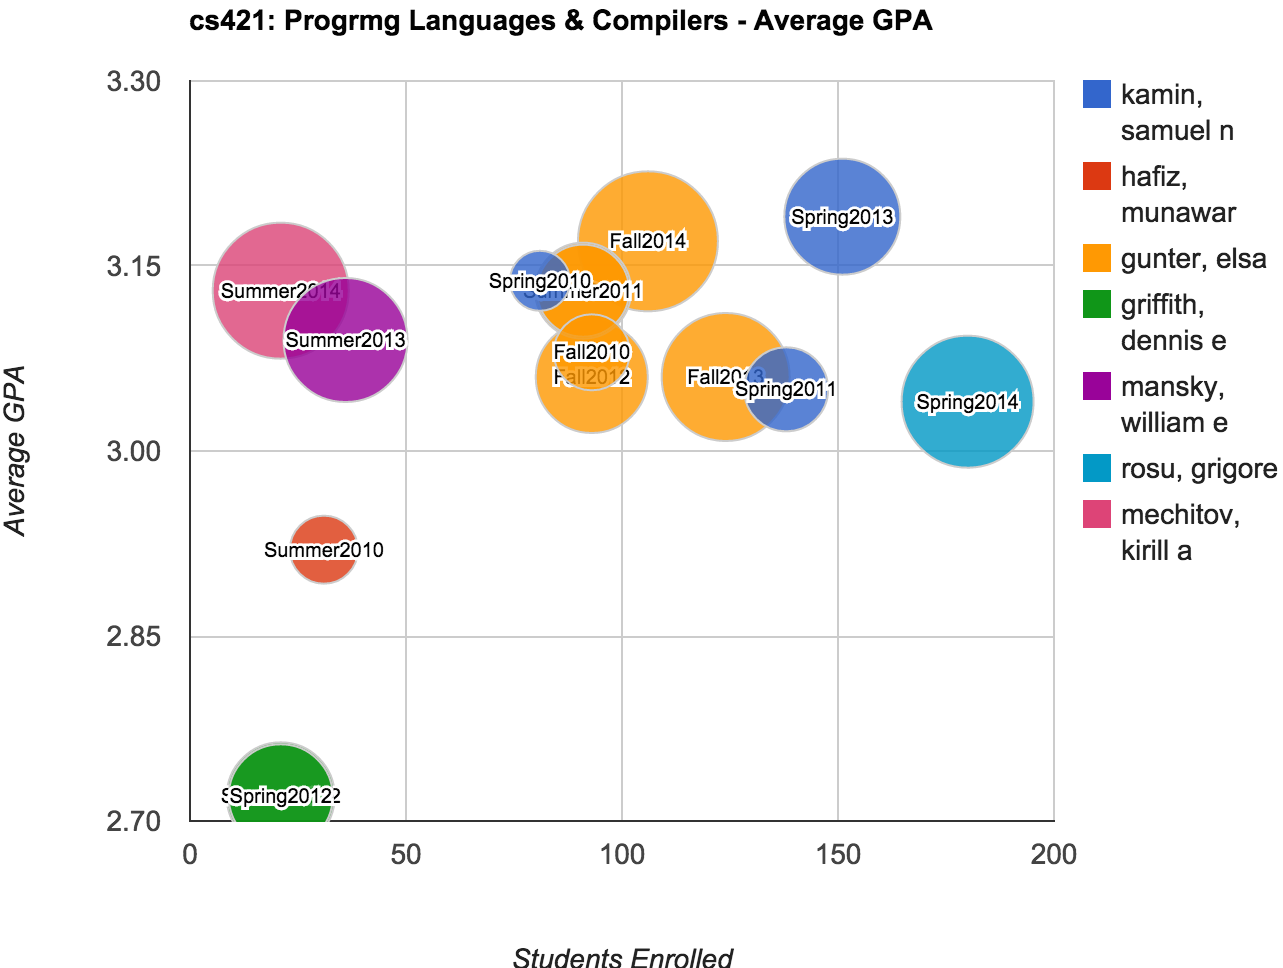
Sure looks like it does! Elsa is right in the middle of the pack, perhaps a bit better than some.
This becomes very important for courses such as ECE 391, where some professors course average GPA is down around 2.5 and others are up around 3.3:

Knowing one professor has a significantly lower on-average grade distribution, definitely impacts decisions on which students take that course. Most importantly graduate and medical applicants need to know this information to maximize the likely-hood of their acceptance.
Prediction
Now that all the data is clearly accessible, I went ahead and tried to make a prediction calculator to determine what the average student will get given their course load. Unfortunately, this seems to break pretty regularly for engineers, but after I graduate (this summer) I plan to send out some surveys and see if I can dramatically improve prediction.
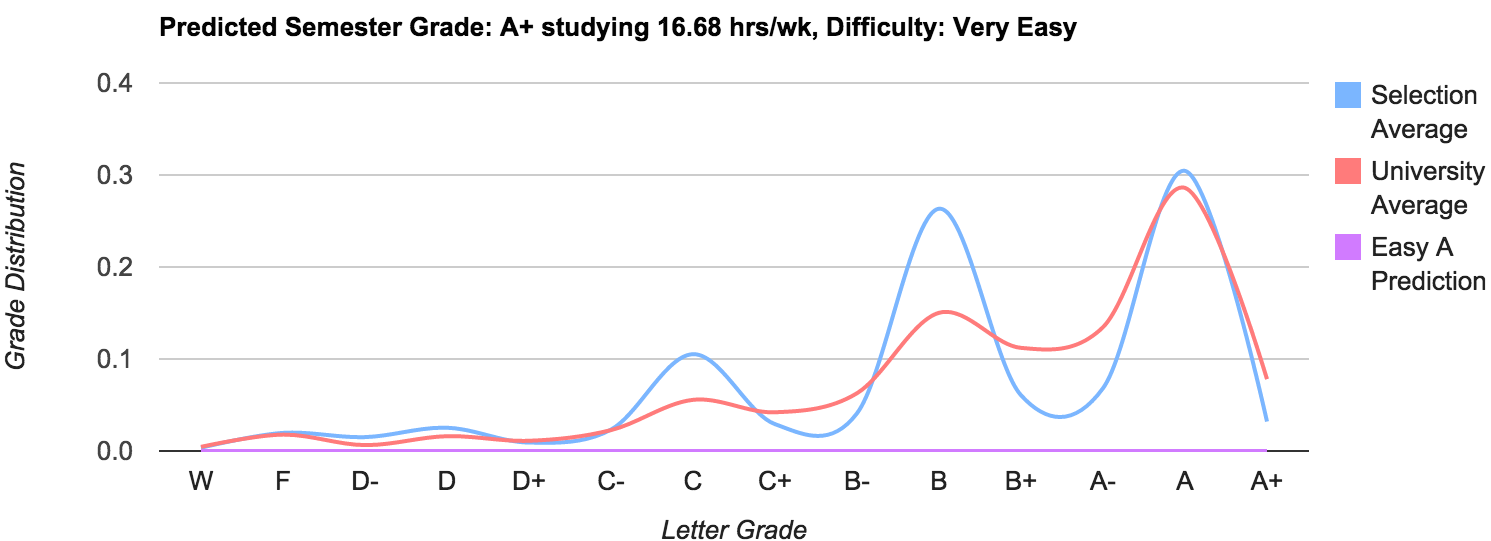
Until then, it is pretty naive, it essentially works by considering the number of credit hours, and difference between the users selected course load distribution and the university average. I realize that’s a lot of words, so here is my drawing:
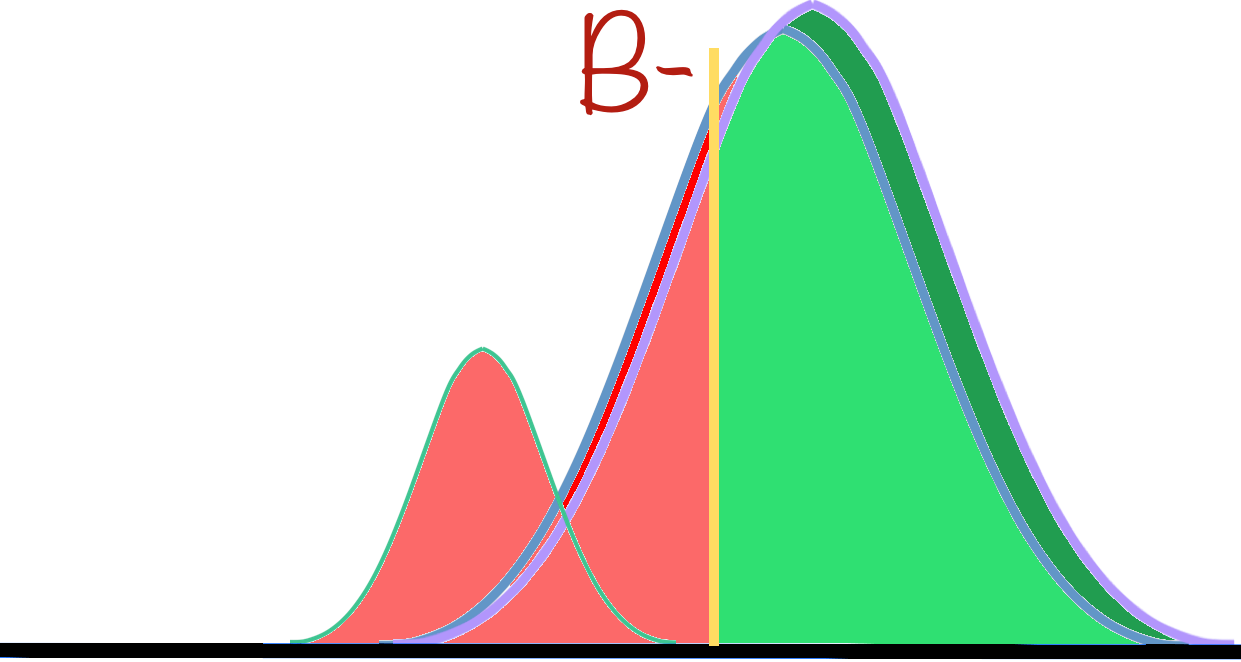
- Purple Distribution (1st from right): users course selection grade distribution
- Light Blue Distribution (2nd from right): university average grade distribution
- Light Green Distribution (3rd from right): weight associated with course load
The dark green represents a higher associated weight, similarly dark red represents a higher associated weight. The method for grade prediction is to then find the middle point of the weighted area beneath the distribution.
It actually works surprisingly well for a rough estimate, and although it breaks probably ~20% of the time, and it is almost always engineers. Further, it is more-or-less impossible to accurately predict a persons grades without knowing their prior grades. Eventually, I intend to have users enter their previous grades, which will let me determine where they generally sit on the grade distribution (i.e. top 25%) then I can predict based off their course selection their likely GPA.
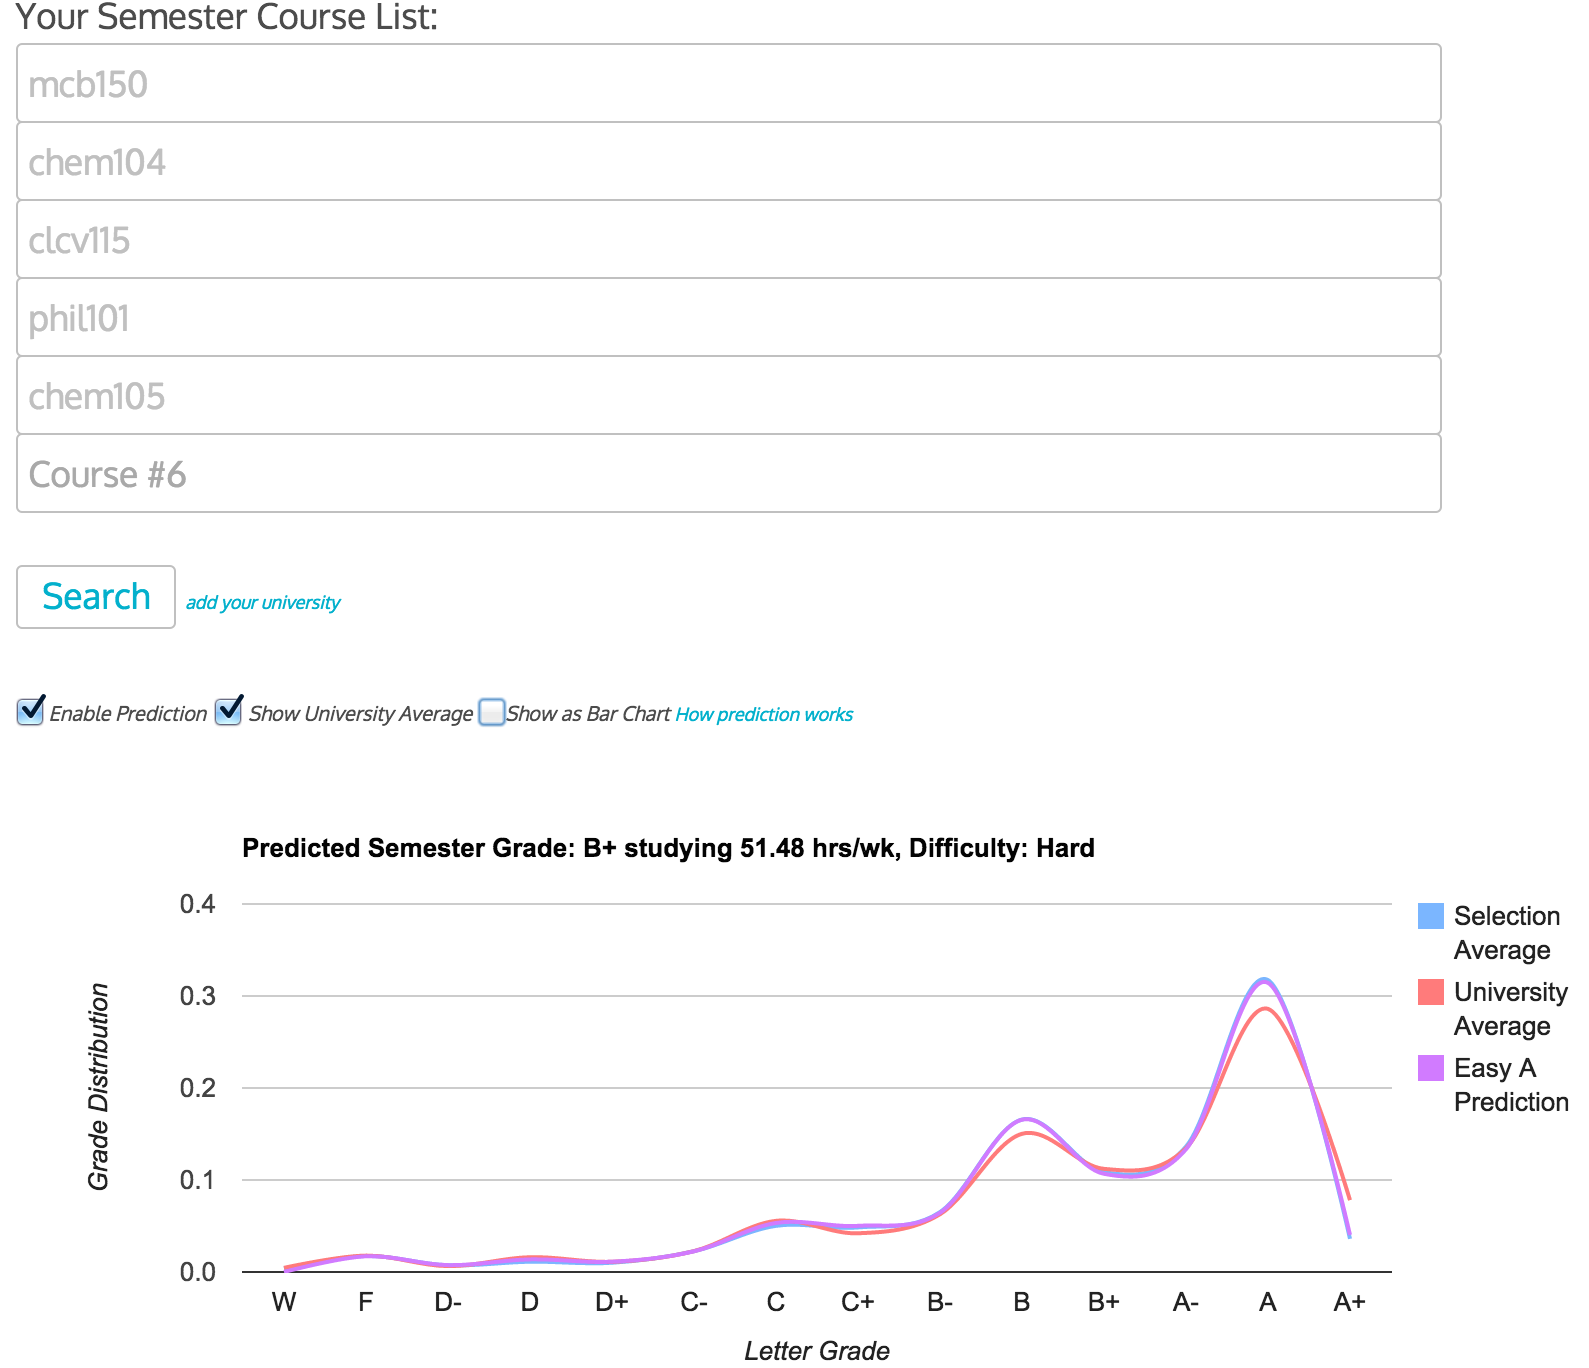
Regardless, with this information, it’s possible to get some really fun outcomes! One friends at UIUC took the following course load their first semester at UIUC:
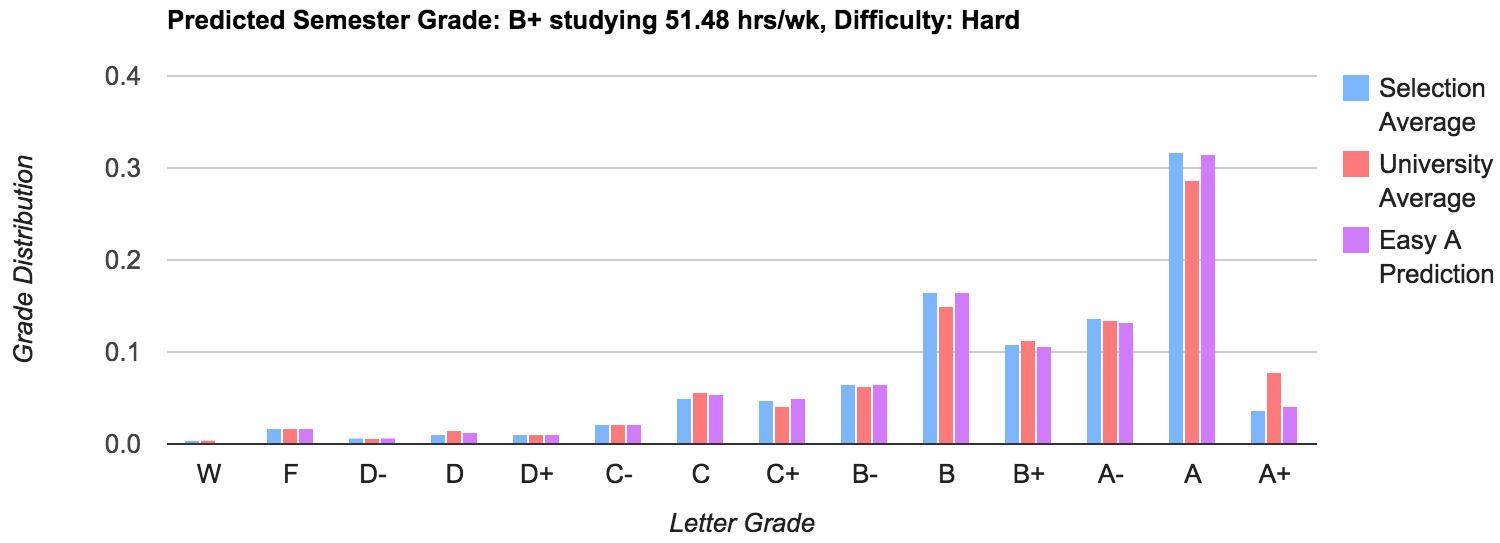
 Or as a bar chart!
It turns out that they ended up with a 3.22 GPA average for the semester, more-or-less exactly what my method of prediction pops out!
Closing Thoughts and More Universities
Finding the UIUC grade distributions was so fun, I decided to make it available to any university! All someone has to do is file a FOIA request a university, then email me that you have the data, and upload it to Dropbox. I’ll then just download it, write some python to get it up in the proper format and it’ll be on Easy A within a few days. Currently, I have two universities on there, and data for two more.
This whole process for me was a proof of concept to learn how to use the google charts API, FOIA requests, and Digital Ocean. I intend to continue to improve the site, adding chat features, recommendations, and perhaps recommended coursework. Easy A is a great way to garner support for several of my other projects, all related to education, such as Synaptitude, Algorithms Rock, and a future project related to fundamental research.