
I’ve always been a bit of a data nut, I love it. It can predict the future, improve understanding, and provide insight into… well, anything! Recently, I was watching FRONTLINE: United States of Secrets, a documentary about what led up to Snowden’s leaks. It is really interesting, and even though I read a ton about the NSA spying, Snowden, that documentary was amazingly insightful!
Anyways, specifically what caught my attention was a bit about how Google reads everything in Gmail, and the NSA collected meta data. This lead me to get curious, and dig into my own email, what could they discover, what could I discover!?
Analyzing Email Data: My Basic Email Stats
I decided to only analyze my main Gmail account, as it is my personal and non-spam account. My main account has been active since 2009, here is a brief overview of my account:
- Total emails: 23,965
- Most popular day: Monday
- Most popular location: Illinois
- Most popular word: University
- Most popular domain: illinois.edu
- Most popular contact: Cole Gleason
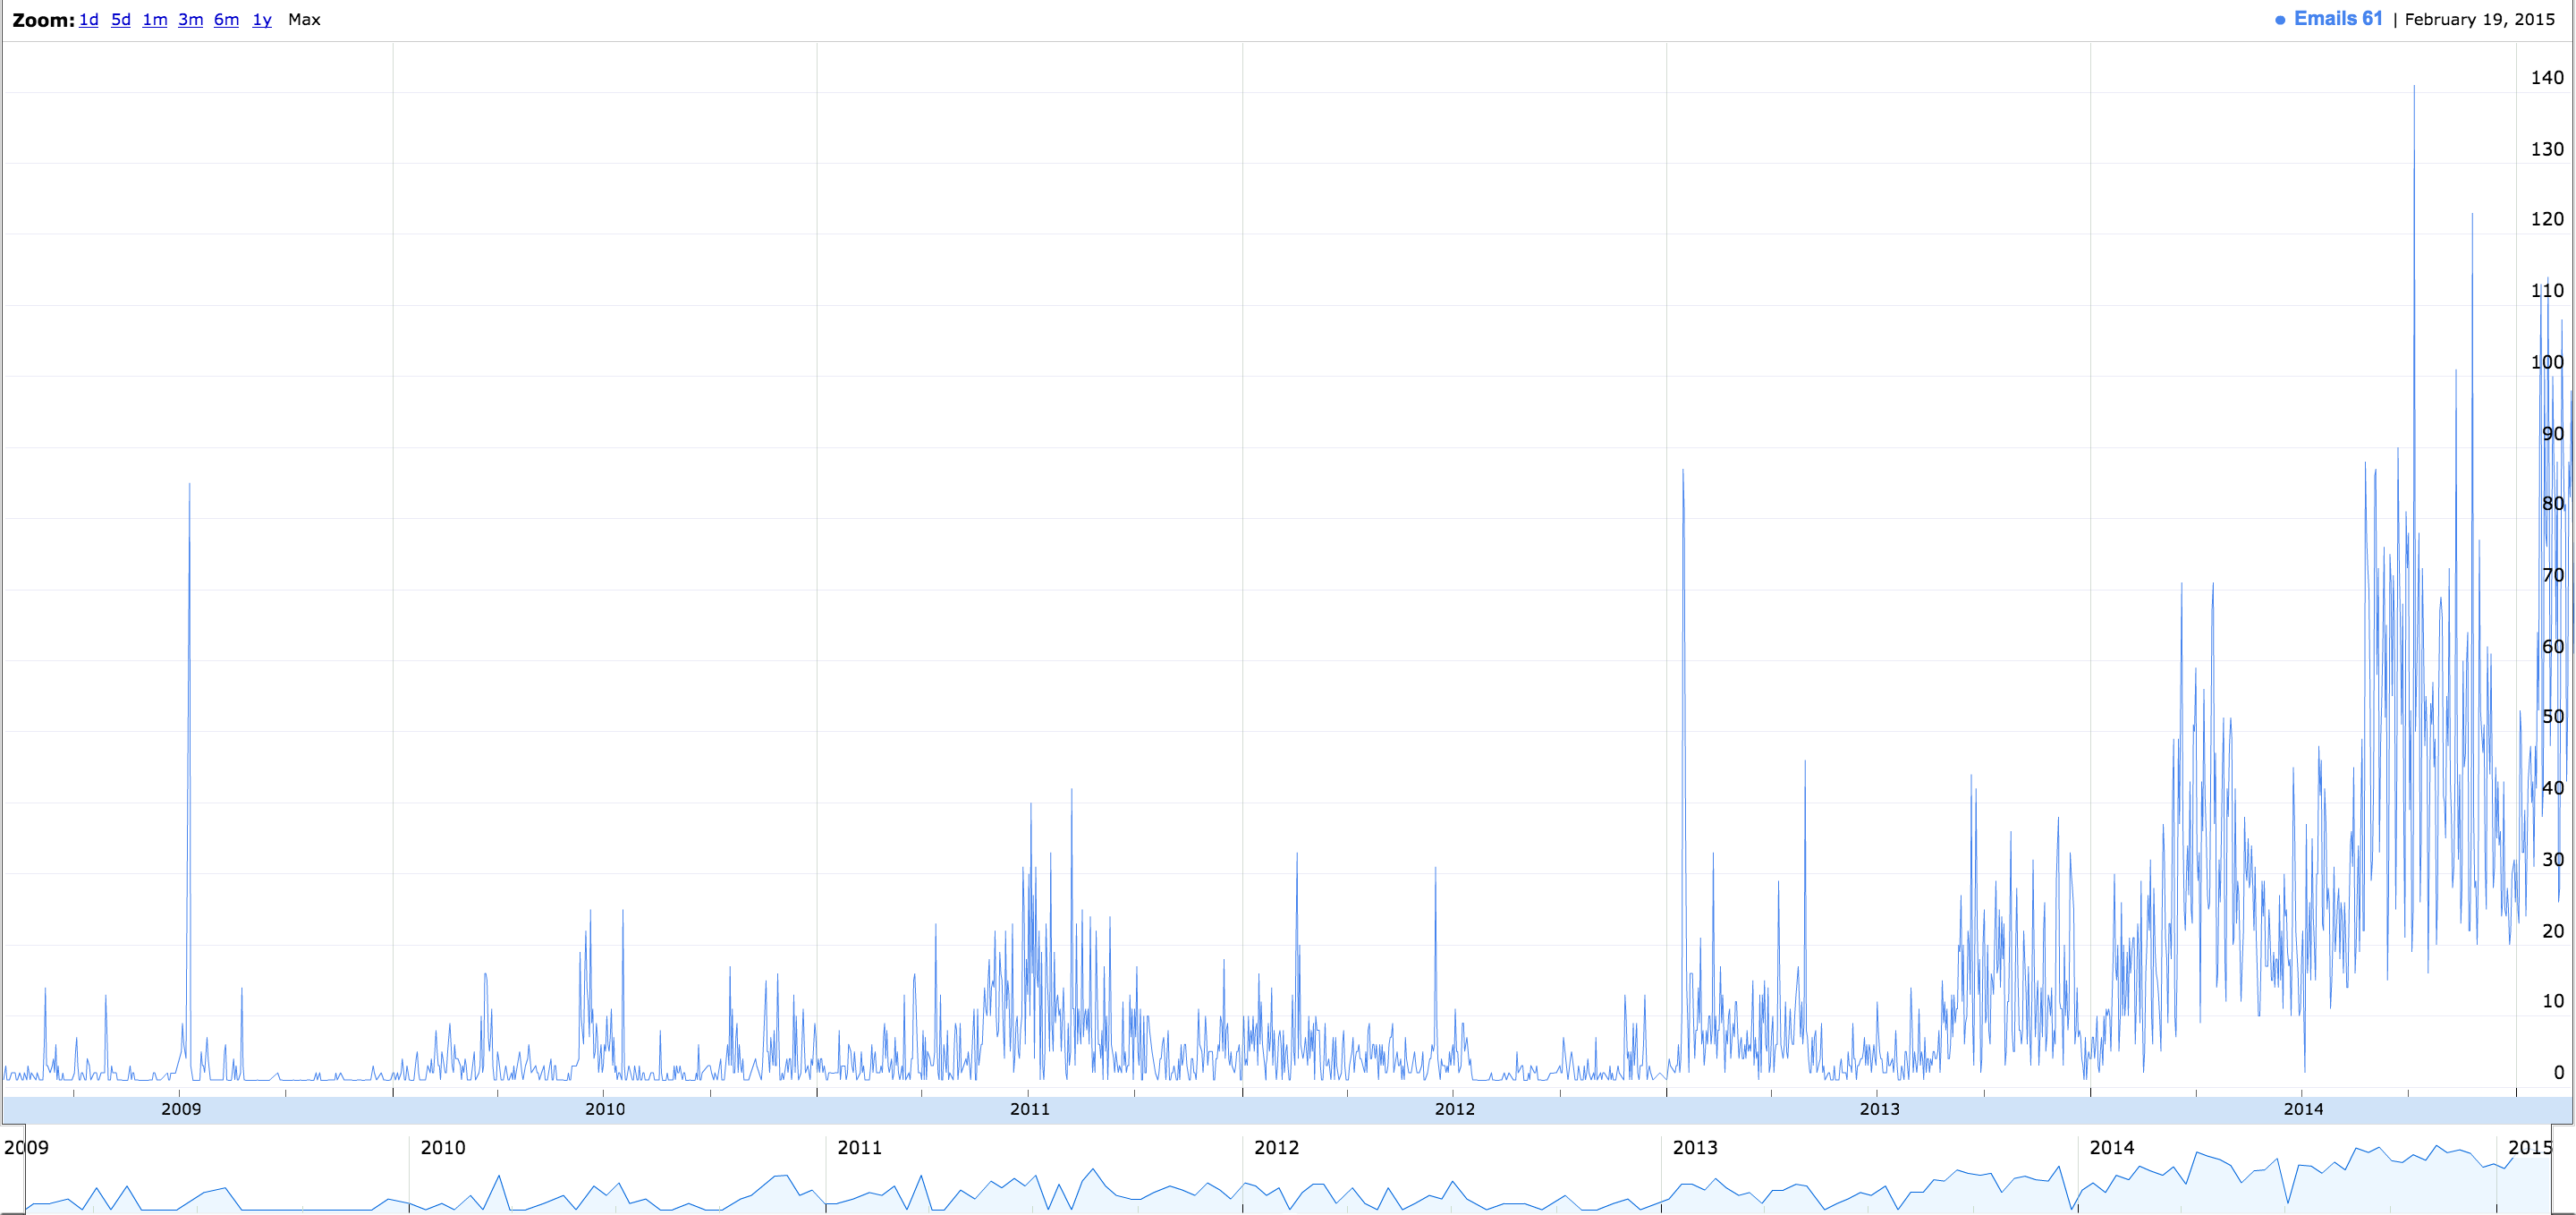
Below is a graph of the emails I received over time, as you can see there is a massive increase since I joined began attending college (2010), and then even more so when I began attending the University of Illinois (2013). Then, the past year (2014 – 2015) I have been treasurer of the UIUC chapter of ACM, which receives a ridiculous number of emails daily (link to interactive graph).
If we break it down by day,
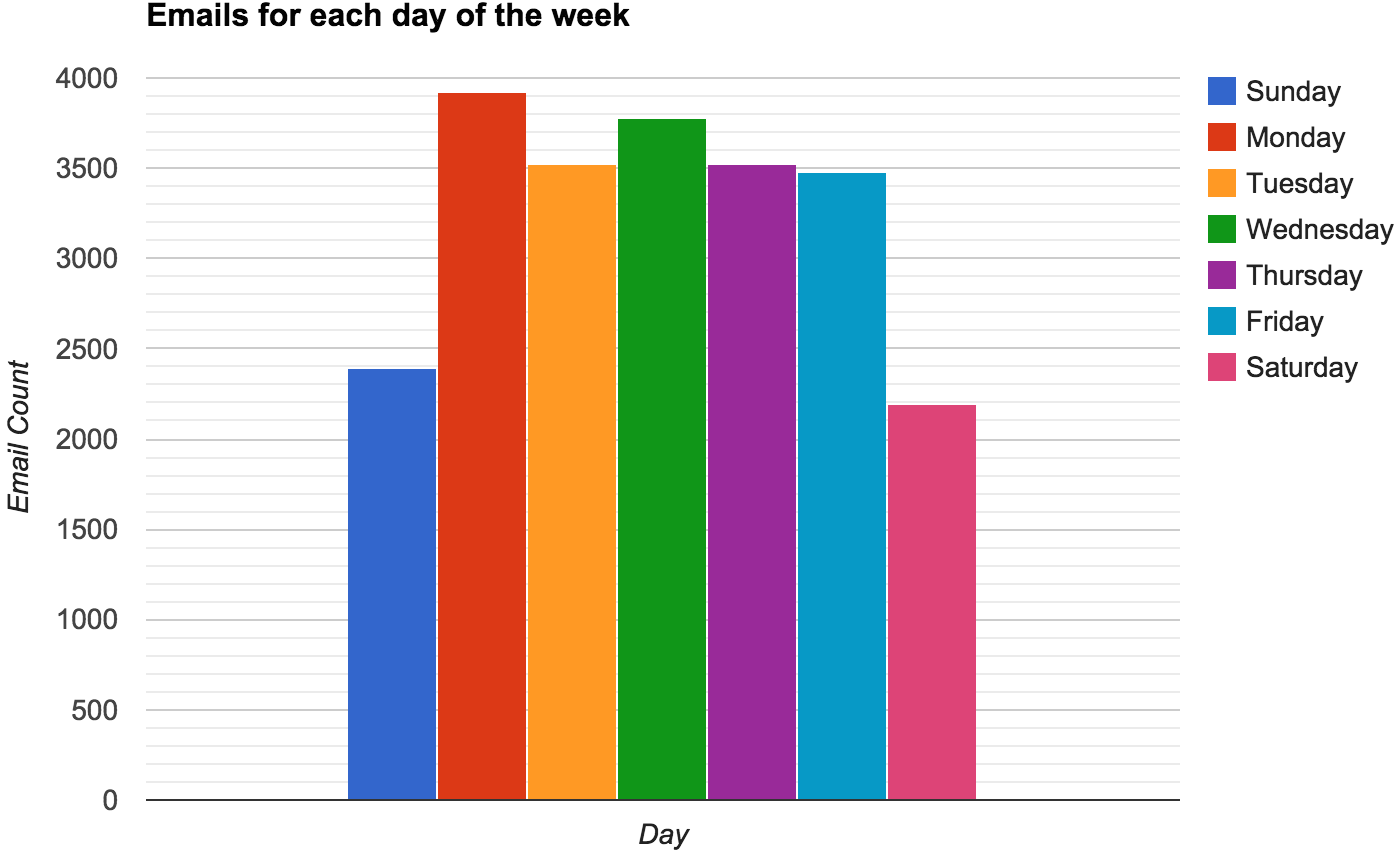
Nothing all that interesting, it was as to be expected. However, as we dig deeper a larger picture begins to emerge…
Analyzing Email Data: Word Frequency
One of the more interesting aspects of analyzing my meta data, was how my emails evolved over time. It is pretty clear what I am interested in, and how my interests evolved over time. Granted, emails are probably not the best measurement of my interests, as I don’t send many emails amongst friends. It does show how my professional interests evolved over time.
For example, you can see my most frequently received/sent word(s) per year below. I did some thresholding and removed the top 25 words, as they were terms such as “send”, “austin”, “this”, “email”, etc. However, the next 25 words were far more interesting, providing insight into my interests.
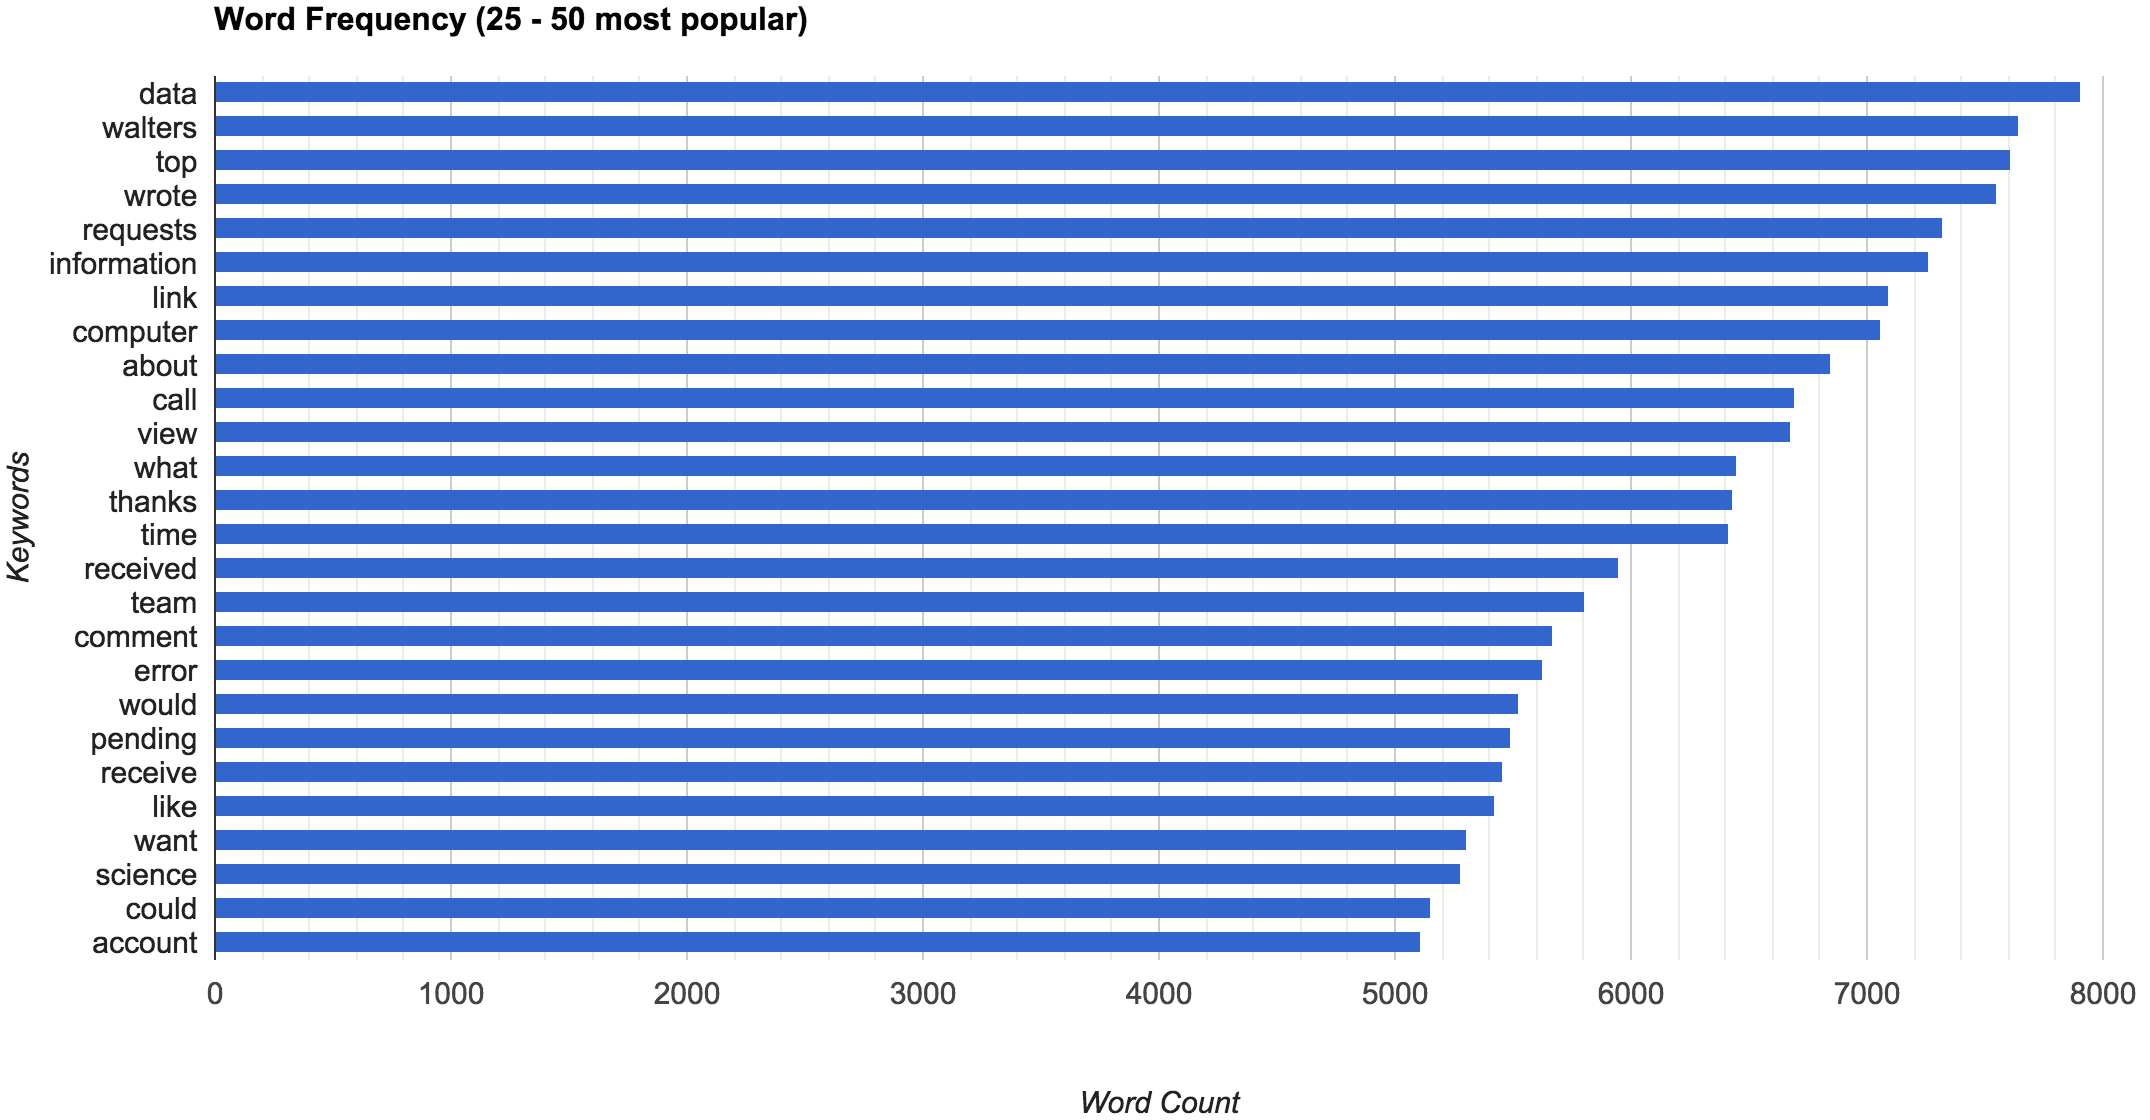 Clearly, I am interested in data, computer(s), science, etc. Unfortunately, even these words do not provide all that clear of an image of my interests. Many of the keywords still seem too associated with general emails, i.e. “receive(d)”, “pending”, “thanks”, etc. I then created a .csv of terms most commonly found in emails, which you can find on my github.
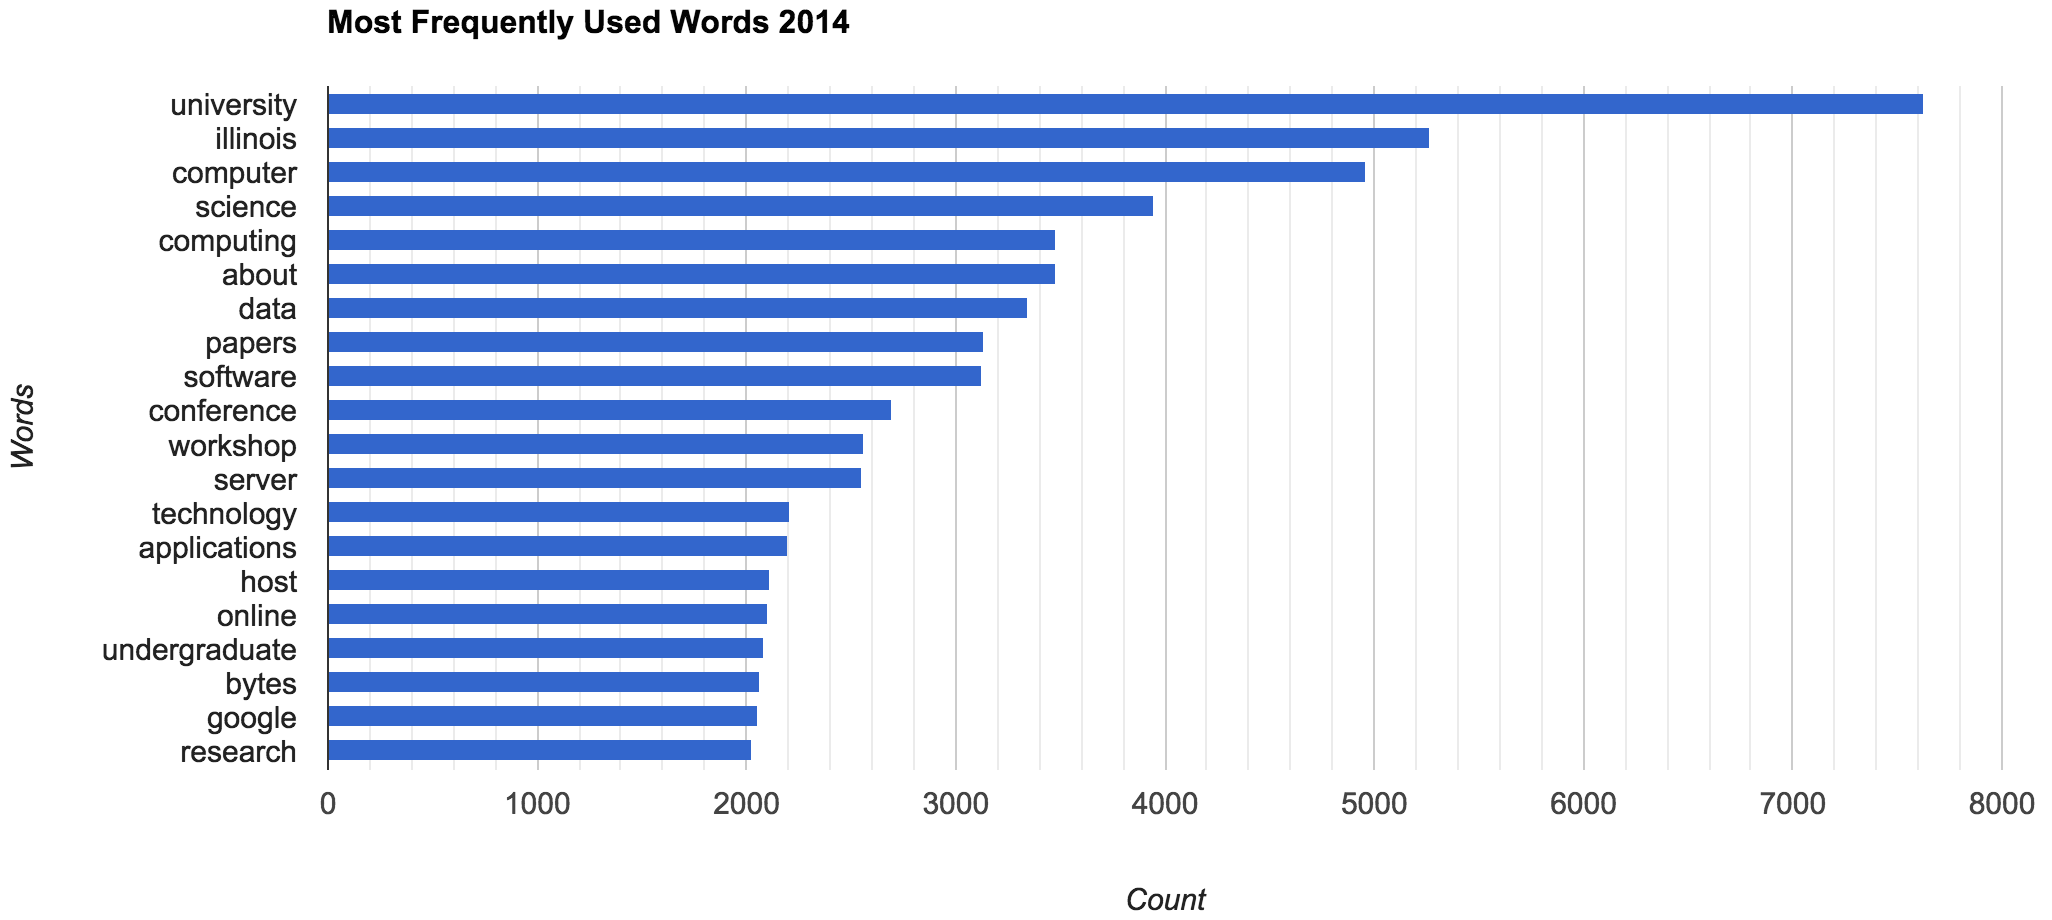
Once we exclude the most common email terms, we get an improved image of what I do and my interests (larger version of the image here).
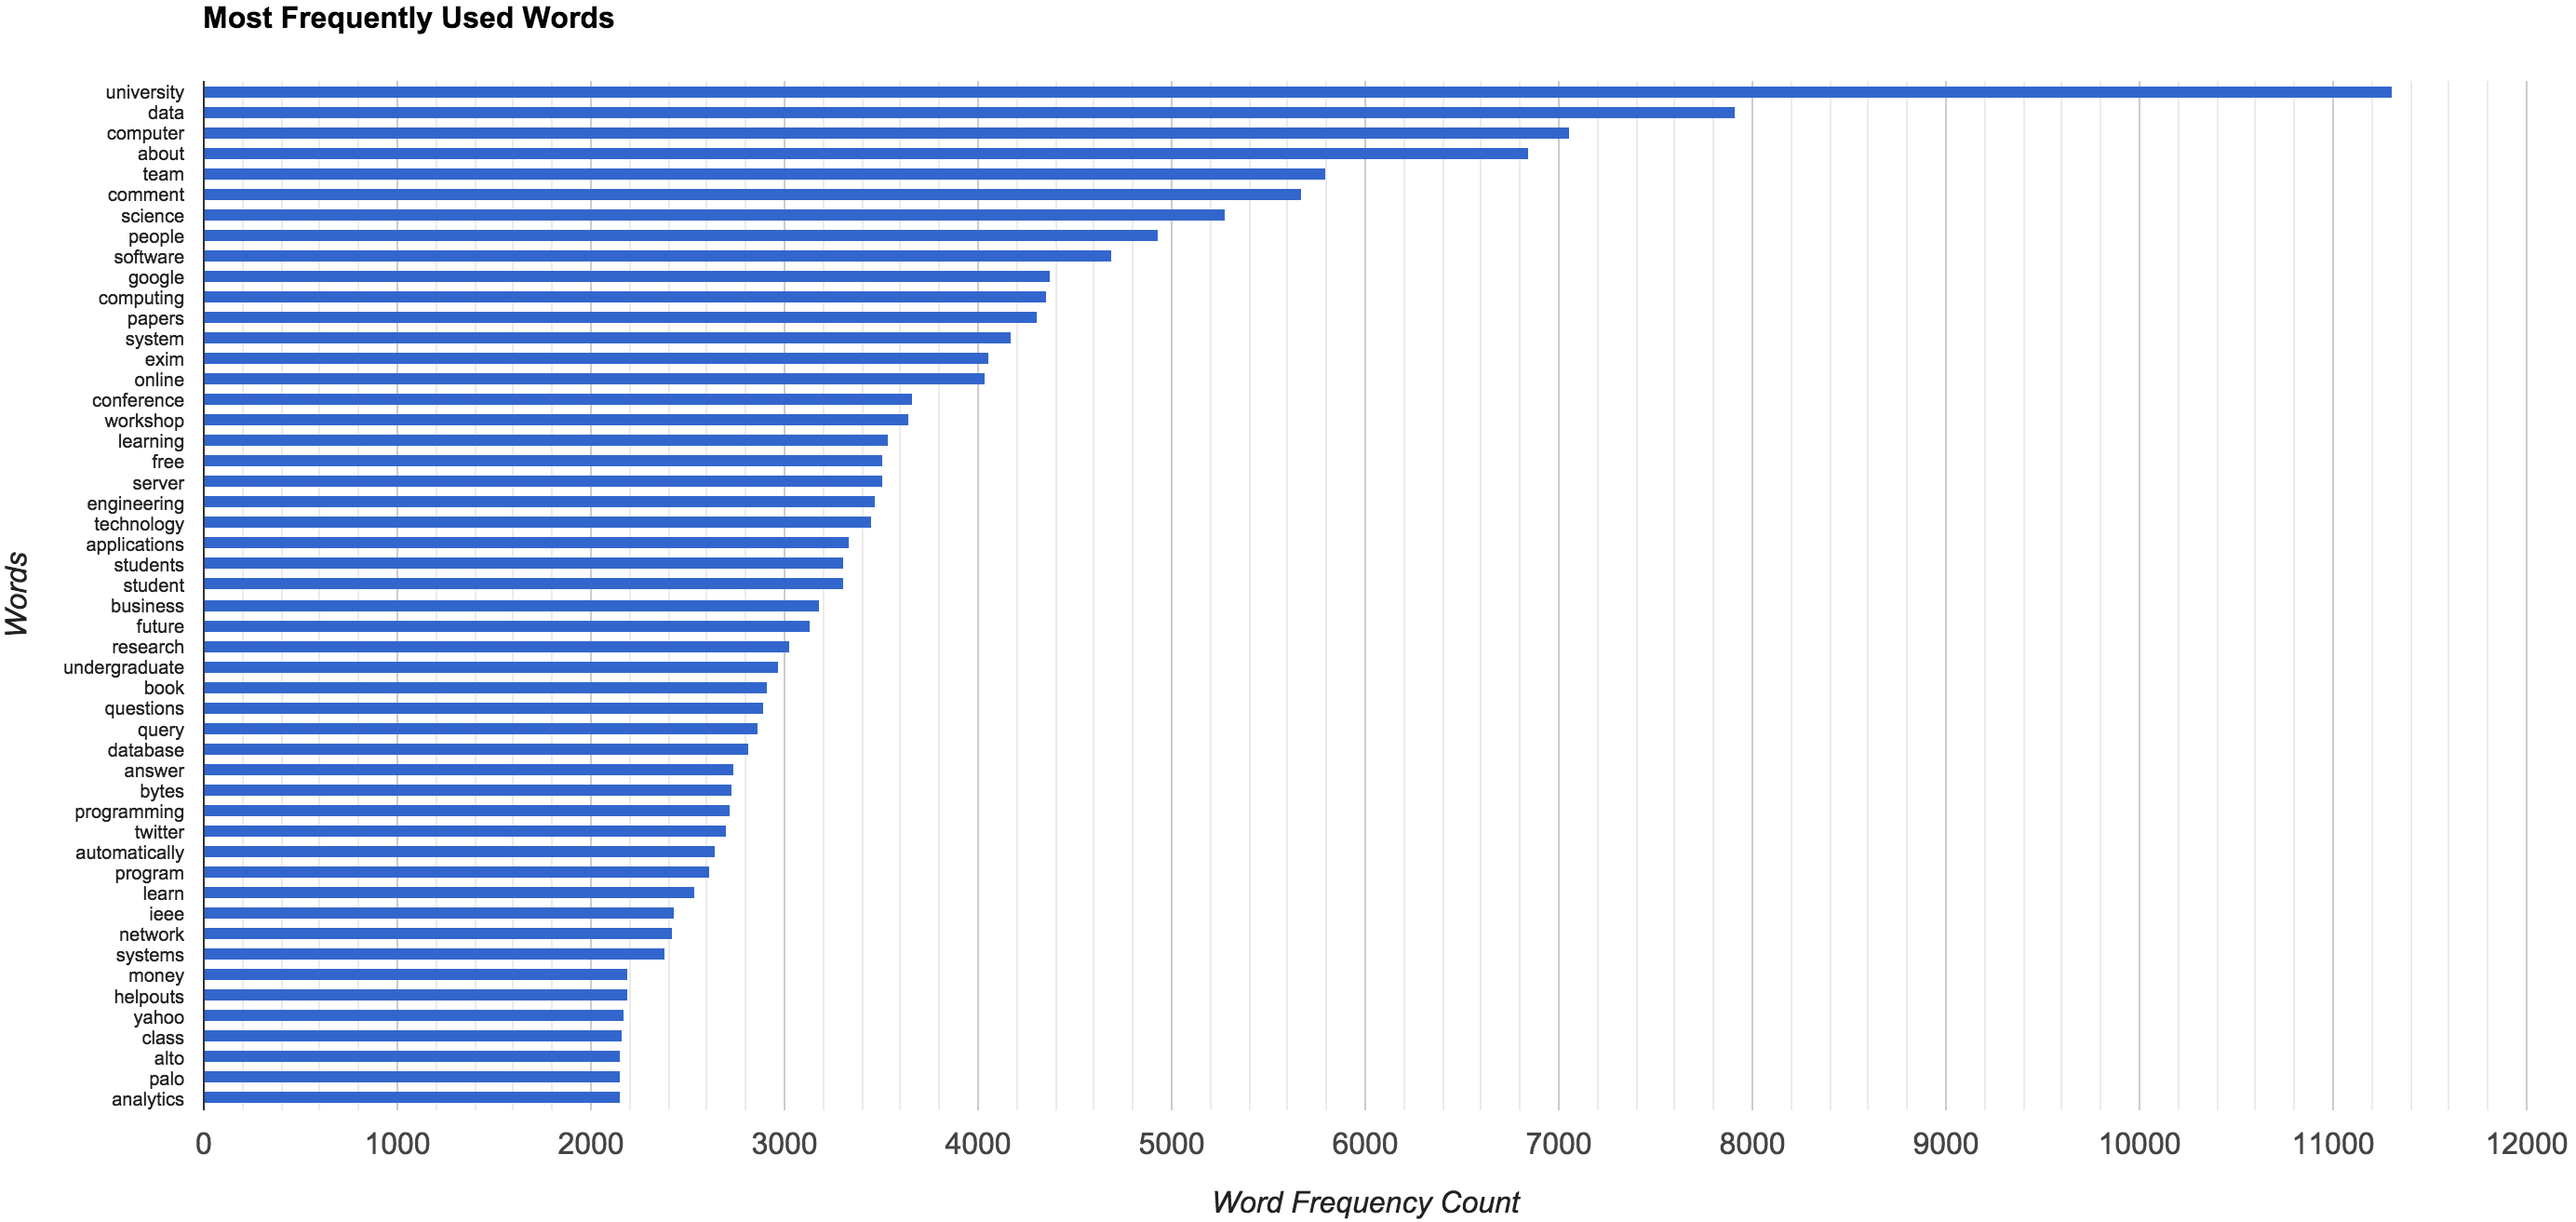
It is a bit difficult to make out, but the five most frequent terms are:
- University
- Data
- Computer
- About
- Team
If we continue to search through the other terms, you will see tons of terms related to technology, software, programming, student, university, etc. It seems pretty obvious (to me anyways) that I am a CS student.
After just analyzing the frequency of words, it becomes clear both my major and stage of life. Further, although I removed all location terms from the chart above the top geological terms found in my email are:
- Illinois
- Champaign
- Urbana
- Joliet
- Palo Alto
- Chicago
This provides a basis for where I live, or at least where I operate the most. Overall the list is fairly accurate and this is done without the use of any IP data, which would tell us exactly who I deal with and where I am located.
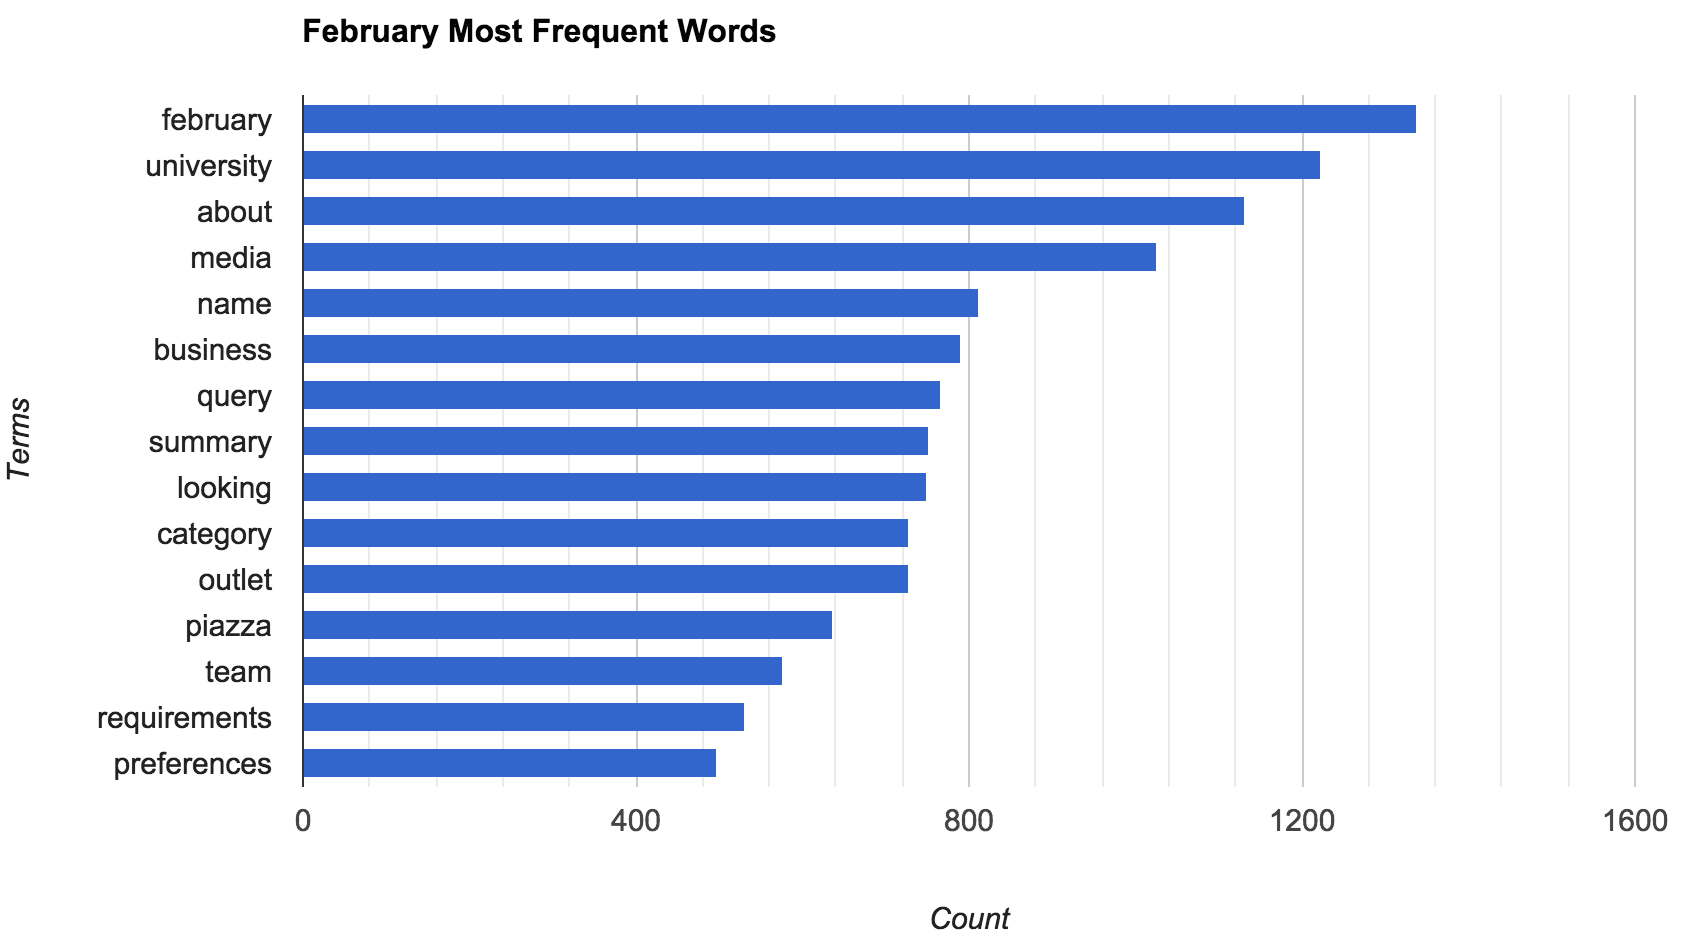
What’s even more interesting to me, is how it is even effected by the seasons. For example, in February seem much more focused on work, probably because I am so gungho about trying to get A’s, and get internships.
Alternatively, in September, I seem to be much more interested in handling people just starting school (either myself or others, through ACM).

It is also interesting to segment out by year, and see how my life evolved over time. In 2011 for example, I used much shorter and generalized words, before I removed all names the majority of the emails contained names such as “I am going to meet so-and-so”. Then in 2014 I was much more “down the rabbit whole” so-to-speak, I was focused on my profession, getting jobs, making software, being a student. This shows my transition to the University of Illinois.

There are probably some more gems in there, but lets move onto how to view who I interact with the most!
Analyzing Email Data: Connections
For me, most of my emails are from educational or company institutions, however there are outliers. Below you can find the website domains I communicate with the most:
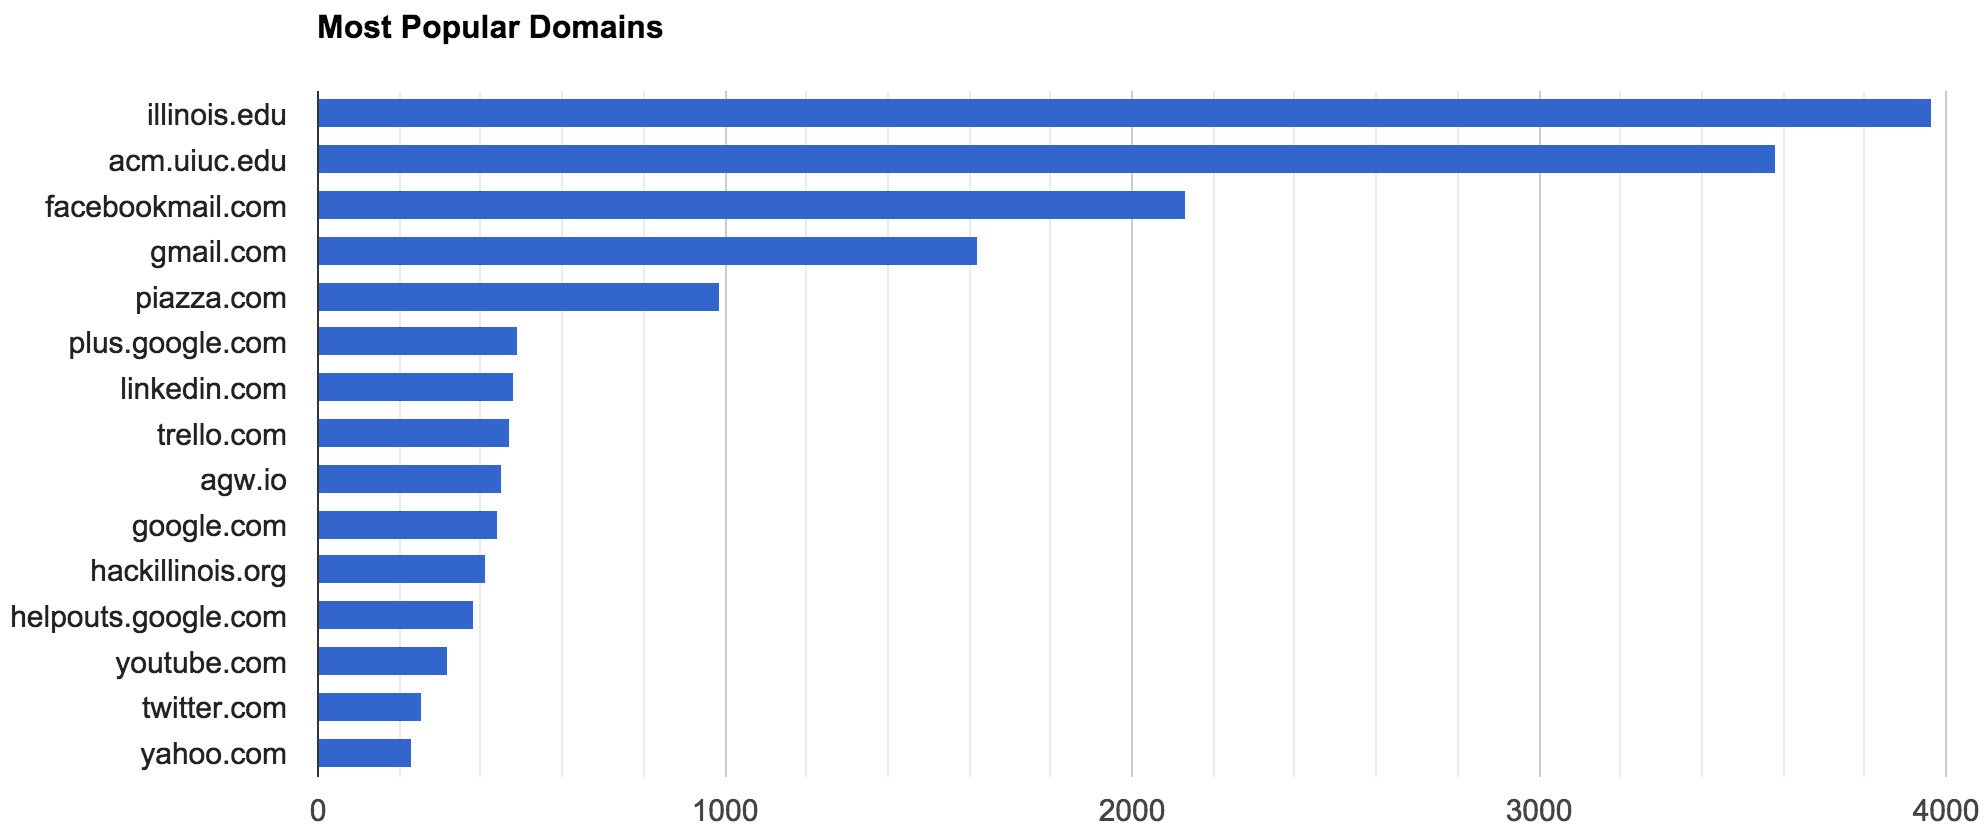
Obviously, this doesn’t tell me all that much, most of them are google or for the University of Illinois. However, if I was subscribing to email updates from various websites, I would likely have a much more interesting spread of my most frequent domains.
Similarly, if we investigate my top emails, my buddy Cole tops the charts, followed closely by piazza (a collaboration tool for school), Trello, then… myself? 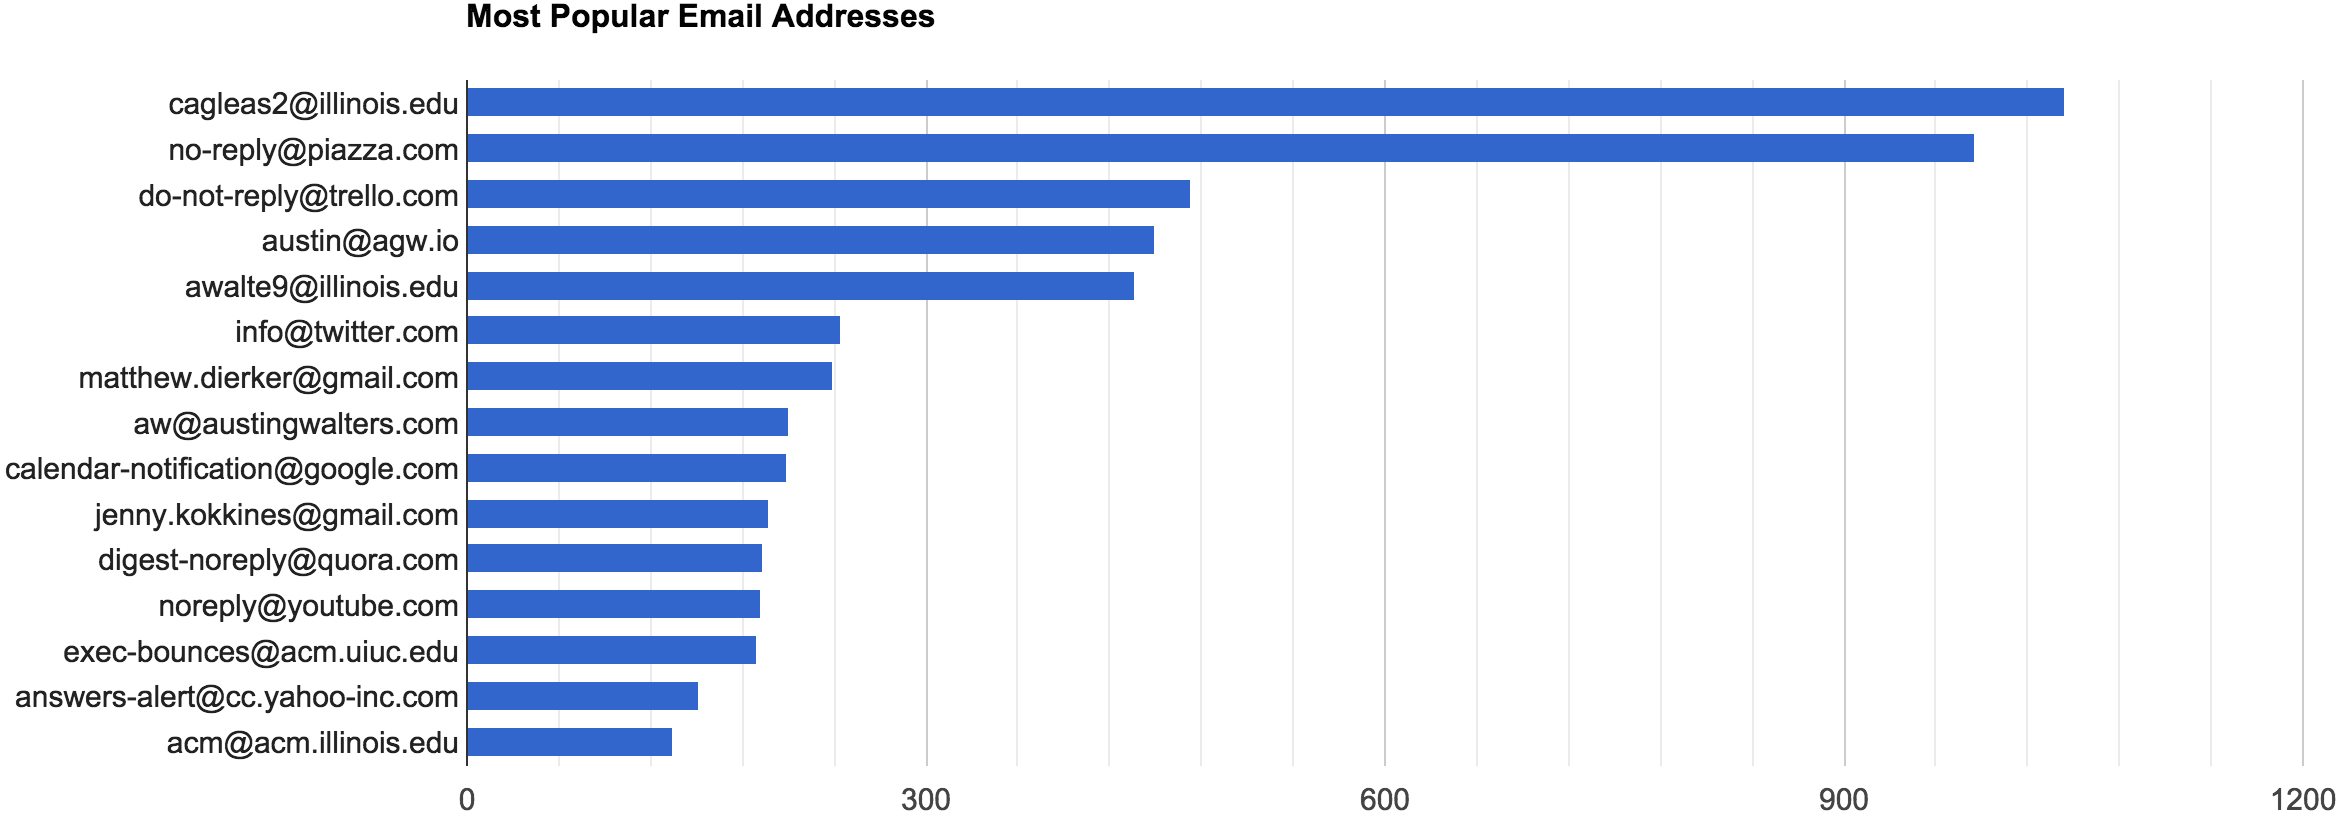
At least, it seems that way on the surface. However, upon further inspection, I have three different email addresses of mine toping the charts, so everything seems well in the world. Now, if we just wanted to see my interest over time, would could just look at the number of domain endings (TLDs), we find out that I am probably in college:
| TLD | Count |
| .com | 10688 |
| .edu | 4251 |
| .org | 833 |
| .io | 462 |
| .net | 297 |
Again, more analysis could be done with this, but let’s show you how you could do this yourself!
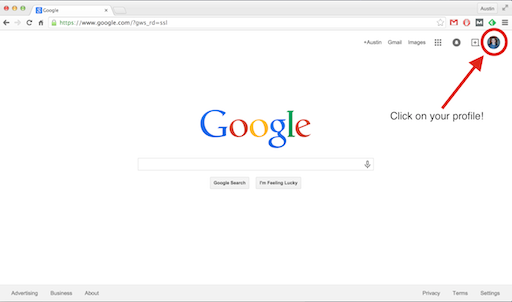
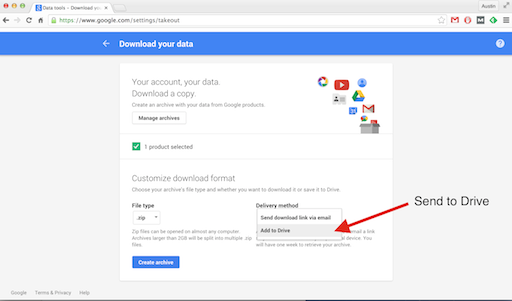
The first step is to just download your emails to a .mbox file. I was able to download them through my Google from my Gmail in five easy steps!
1. Click on your profile
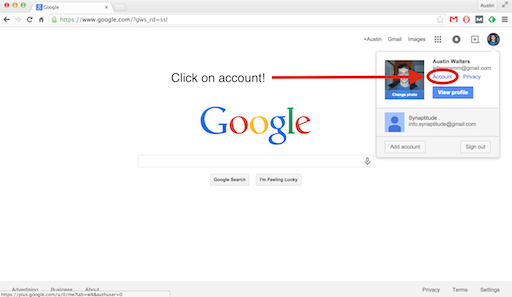
2. Click on account
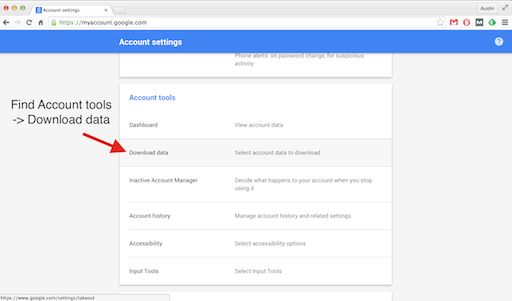
3. Find account tools, then download data
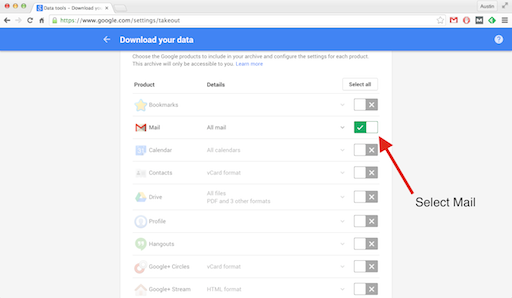
4. Select all -> none, then mark mail
5. Add to drive (quicker delivery)
Once you receive the .zip file, download and unzip it. Then download my code from github, under Email_Analysis. The code is about the smelliest I have ever written, as I wrote and tested everything (including this article) in about 6 – 8 hours, but it should work for almost everyone.
After downloading the code:
- Put the .mbox file in the same directory as the code
- Rename the .mbox to “mail.mbox”
- Run each script <name>.py
- Wait 2 – 3 minutes per Gb
- Load the .csv files into excel, sheets, what have you
I recommend reading the README as always, and I make no guarantee this will work perfectly for you. In fact, you’ll probably have to edit the .csv files to a large extent, removing the items I label “None” (i.e. no data available), as well as doing some of your own thresholding.
All of us use receive different amounts of spam from different places, so removing that from your data will be somewhat manual or you’ll have to edit the scripts. Regardless, I hope most of this works for you out there!
Feel free to post an update on github if you make any changes!
I really like what you’ve done with this, it reminds me of the analytical data provided by Wolfram for one’s Facebook profile meshed with the now defunct Xobni Outlook plugin. Very well done!
On an unrelated note, I’m particularly fond of your theme, specifically the way pictures are loaded gradually as you scroll down to them. Might I inquire what theme you’re using and/or what plugin is controlling that?
I am using the Foghorn theme, with quite a bit of editing I did myself.
For the images loading slowly, I am using the advanced lazy load plugin. It is supposed to make your pages slightly faster to load (since they only load as you scroll down). There is a slight improvement, but not much.